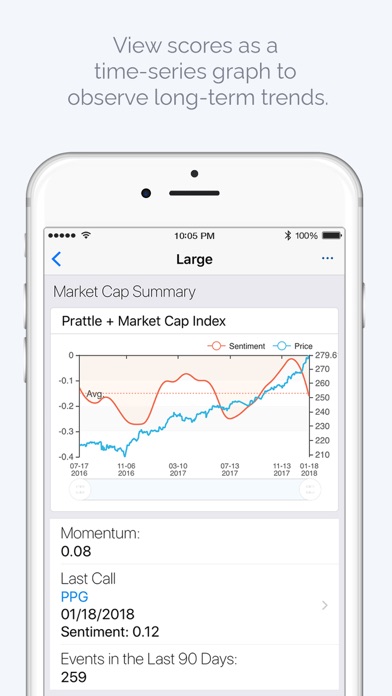
Have you ever wanted to know how a company’s language will impact its stock price? Prattle’s algorithmically generated sentiment scores can tell you.
Use the Prattle Equities app to:
·Access predictive sentiment data on thousands of publicly traded companies
·Create a custom watchlist of stocks in your portfolio
·Track industry or sector-wide sentiment trends
·Receive real-time push notifications when a company on your watchlist releases a market-moving communication
Proven Predictive. Powered by Machine Learning.
·Prattle assigns each communication a sentiment score centering around zero, with positive numbers indicating a positive outlook and negative numbers indicating a negative outlook relative to the benchmark.
·Communications are ranked by percentile for easy comparison to previous releases from the same company.
·Independent backtests performed by Lucena Research have shown exceptional performance in portfolios using Prattle sentiment scores as trading signals.
·The machine learning component of Prattle’s system continually integrates new language, improving the predictiveness of each company’s data as new language is learned.
·Identify how closely a company’s scores correlate with stock price performance using Prattle’s Quantified Investment Parameters (QUIPs). Companies are ranked between 1-5 QUIPs based on how well their scores predict stock price movement relative to the benchmark.
-------------------------
How it works:
·Prattle uses text analytics and machine learning to analyze the historical relationship between a company’s language and its stock price movement.
·Prattle scores are based on reference documents (e.g. prior earnings calls) that have led to identifiable market reactions.
·A custom lexicon is created and maintained for each company based on its unique language patterns.
·The algorithm breaks down and assesses communications by analyzing specific words, phrases, sentences, and paragraphs that are mathematically linked to market reactions.


